46
5. Evaluation and results
The training and test datasets, which were pre-processed earlier (section 4.3. Pre-processing
of the NSL-KDD dataset) showed that they were very different from each other, especially
when it came to the distribution of the traffic type labels (
) and of the difficulty levels
22). This divergence led to interesting results in the experimental phase of
this project, where the models described above ( Classification models analysis) were put to
the test. It was observed that the test dataset, on which predictions were made, showed far
lower accuracy scores than the accuracy acquired during training. Naturally, overfitting was a
problem that was first addressed, but still the models seemed to stabilise at the performance
shown below, in
. For a deeper view into the performance of the models and the effect
of the differences between the KDDTrain+ and KDDTest+ datasets, two cases were created: in
case A, the five models were applied to all the classification scenarios (multiclass, binary, 4-
class), using the KDDTrain+ as training dataset, and the KDDTest+ as test (validation) dataset,
as they were prepared during the pre-processing phase (4.3. Pre-processing of the NSL-KDD
dataset). In case B, the same models were used (mostly with the same parameters that
optimized their performance) on all the classifications, but here only the KDDTrain+ was used
as training and test set, by splitting it with the commonly used train_test_split [30] utility from
the sklearn library, after being pre-processed like before.
When the same algorithms were applied to case B, it showed that the models were working
exceptionally, as is shown in
. Due to the very homogenous distribution of the training
and validation parts of the dataset, the performance both in training and testing phases is the
same and gets very high results.
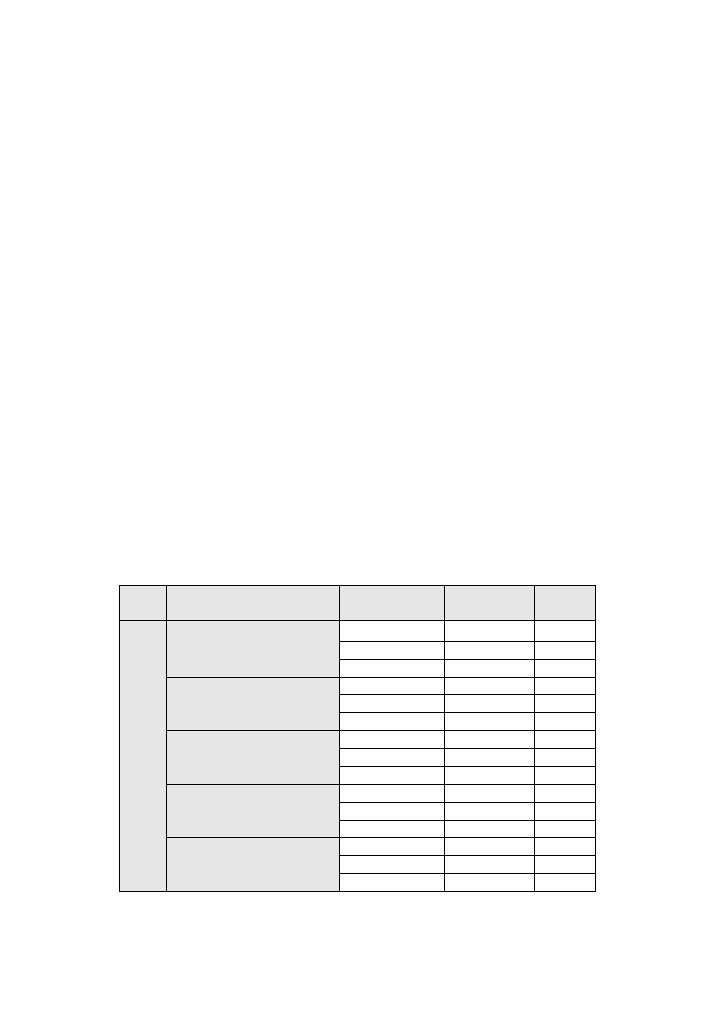
Table 7: summary/comparison of classification algorithms performance in case A
CLASSIFICATION ALGORITHM CLASS SCENARIO TRAINING SET TEST SET
C
ASE
A:
u
sin
g t
h
e
KD
D
Tr
a
in
+
an
d
KD
D
Test
+
as
train
in
g and
t
est
se
ts
LOGISTIC REGRESSION
multi
0,99
0,70
binary
0,97
0,75
4-class
0,99
0,76
DECISION TREE
multi
1,00
0,71
binary
1,00
0,79
4-class
1,00
0,76
K NEAREST NEIBOURS
multi
0,99
0,72
binary
0,99
0,77
4-class
0,99
0,74
GAUSSIAN NAÏVE BAYES
multi
0,77
0,53
binary
0,84
0,55
4-class
0,65
0,42
MULTI LAYER PERCEPTRON
multi
1,00
0,72
binary
1,00
0,79
4-class
1,00
0,77